UpLink
High-altitude balloon payload flown to 28.42 km over Montana. I designed the printed enclosure, ran the CFD and thermal analysis that decided how it was built, and wrote the dashboard we chased it with.
High-altitude balloon
Fusion 360
OpenFOAM
CFD
3D printing
Next.js
28.42 km
Burst altitude
140 km
Downrange
491 g
Total flight mass
44 g
Printed enclosure
UpLink was a high-altitude balloon payload. It launched from Townsend, Montana on August 16, 2026, burst at 28.42 km, and came down about 140 km downrange near Judith Gap. We never found it. The radio went quiet about fifteen minutes before it landed, so we searched a three-kilometer circle of farmland on foot with no final position.
I designed the printed enclosure that carried the electronics, ran the thermal analysis that decided how it was built, wrote the dashboard we navigated the chase with, and drove. This page is about those parts.
The enclosure
Most amateur balloon payloads fly in a styrofoam shipping box. It's a good insulator and easy to cut, but it comes in fixed sizes, wastes volume around an awkward board, and spends about 200 g of an allowance you then have to lift. On a 350 g Kaymont balloon that's real money in helium. Our whole flight train (parachute, line, electronics, enclosure) came to 491 g.
I designed the case in Fusion 360 over about twenty-five revisions, working to the board outline and component list Andrew gave me. It's a cylindrical body with a printed lid and bottom cap, molded standoffs for the PCB, pockets for the camera, the SMA bulkhead and the temperature sensors, and one mounting hardware pattern throughout so nothing needed its own screws.
The parts print in Sunlu LW-PLA, a foaming filament that expands as it extrudes. Andrew worked out the print profile for it. The finished case weighed 44 g against 74.16 cm³ of CAD volume, so 593 kg/m³, which is 48% of solid PLA. The filament did foam, but only to about half density, not the two-thirds void I assumed when I first sized the thermal model at 25 g.
One thing the analysis caught that I missed while drawing it: at the perimeter counts we used, every part prints solid. Four 0.4 mm perimeters per side eat the entire 3.33 mm case wall, and the six-perimeter caps overrun their 3.27 mm wall by 1.5 mm, so the slicer drops perimeters and gap-fills instead. There's no sparse core anywhere in the payload, so the infill percentage does nothing. An infill sweep would have returned the same number three times.
Simulating the cold soak
The question I wanted answered before we flew was narrow: does the electronics stay inside its temperature ratings, in this enclosure, on this flight?
Doing that as one fully coupled transient CFD run isn't feasible. A 131-minute flight at the Courant limit is about 35 million timesteps, which is years of wall clock for a question that needed answering that week. So I split it in two. That drops the resolution of the external eddies and keeps the physics that sets the answer.
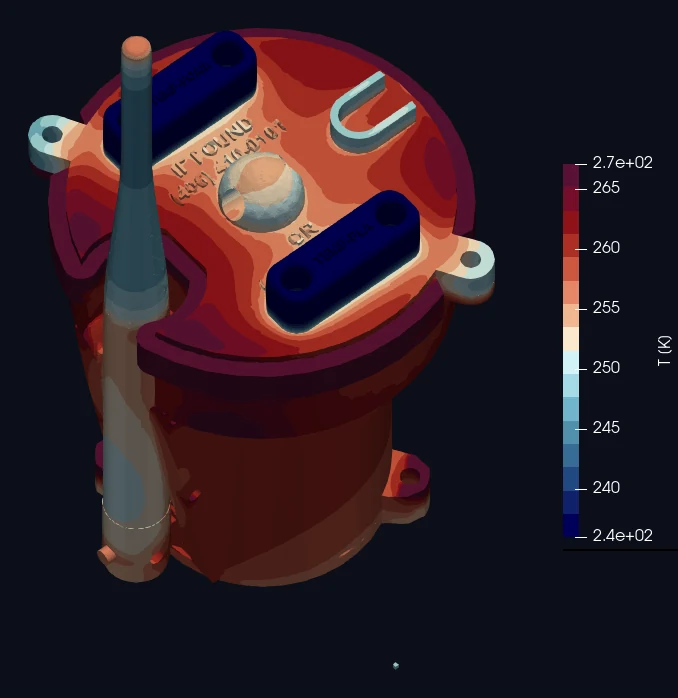
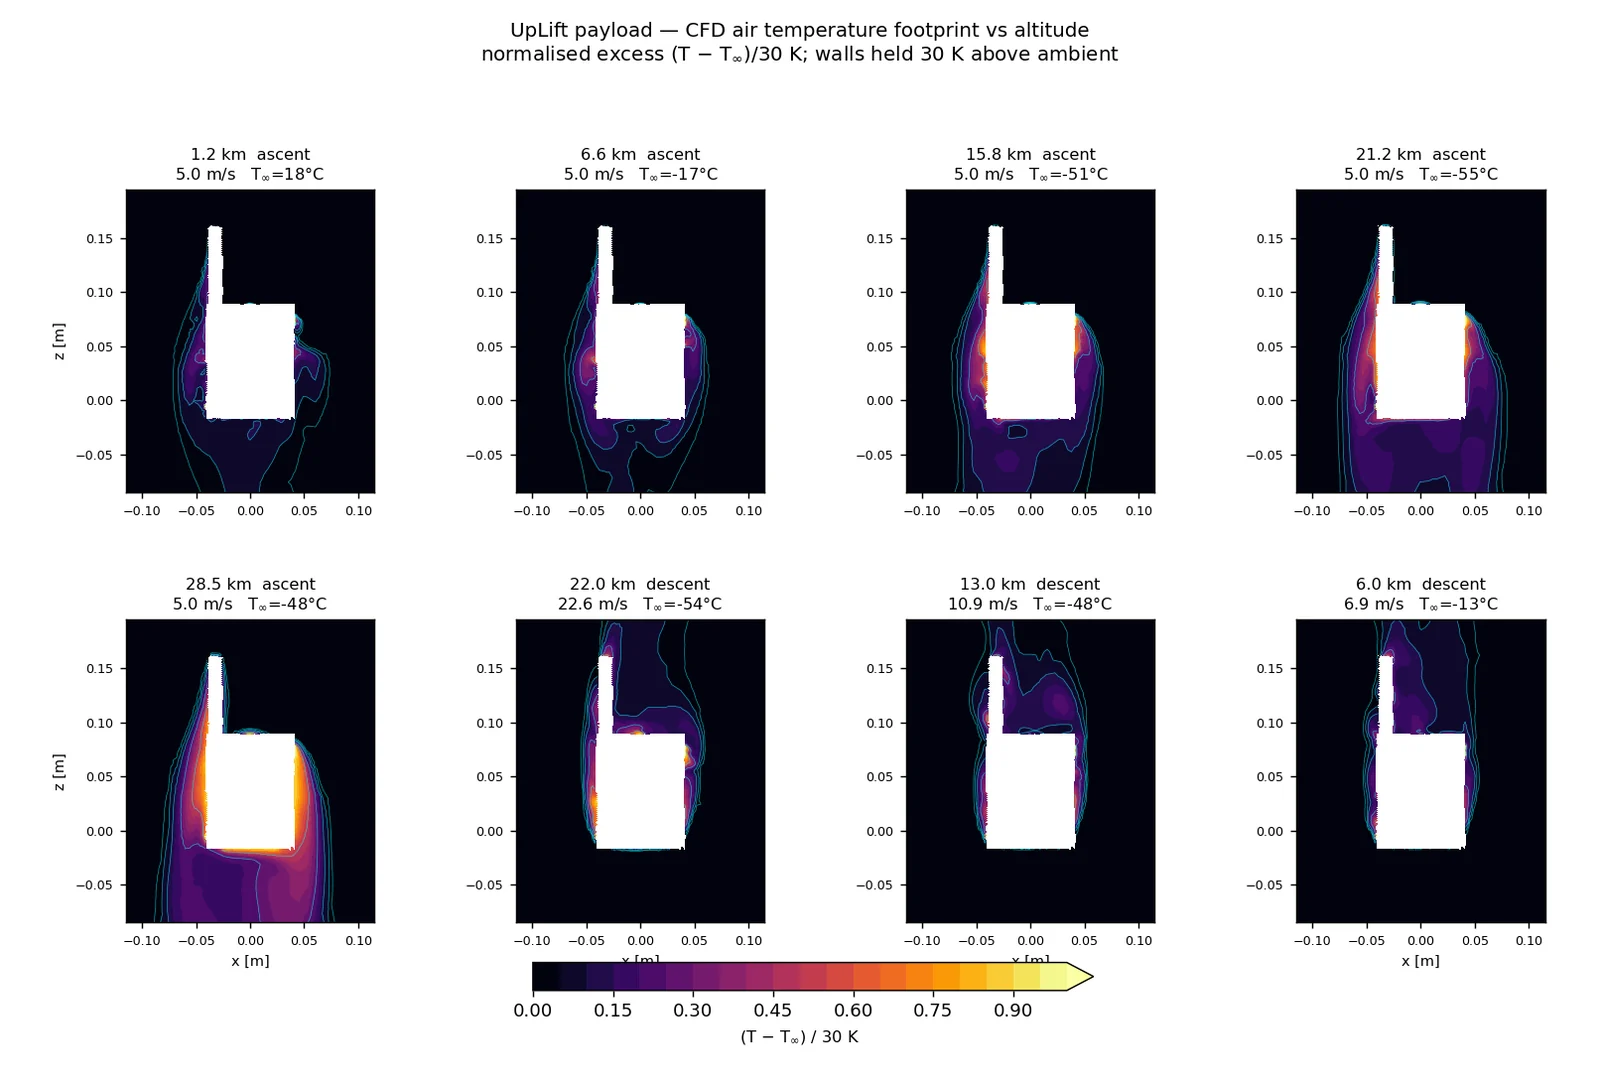
Stage A is external convection: steady compressible laminar flow past the real CAD geometry at eight flight conditions from 1.2 to 28.5 km, on ascent and descent. A 247k-cell snappyHexMesh with prism layers, walls held 30 K above ambient, and the convective coefficient recovered per patch as h = q/(T_wall - T_inf) from the solved wall heat flux. Treating it as laminar holds up across Re 693 to 24,000 for the forward surfaces. The separated wake is the least trustworthy part of the whole model.
Stage B is the transient payload: a three-node model of shell, interior and antenna, driven by the Stage A conductance interpolated in log(Re), a four-term radiation budget of direct solar, albedo, Earth IR and cold-sky IR, and the SondeHub flight profile. Biot numbers of 0.018 to 0.094 at altitude say the parts really are isothermal up there, so a full conjugate solve would have cost a lot and added no physics. The cavity air holds 0.001% of the payload's thermal mass, so the void has no dynamics of its own. OpenFOAM 14 throughout, ParaView for the fields.
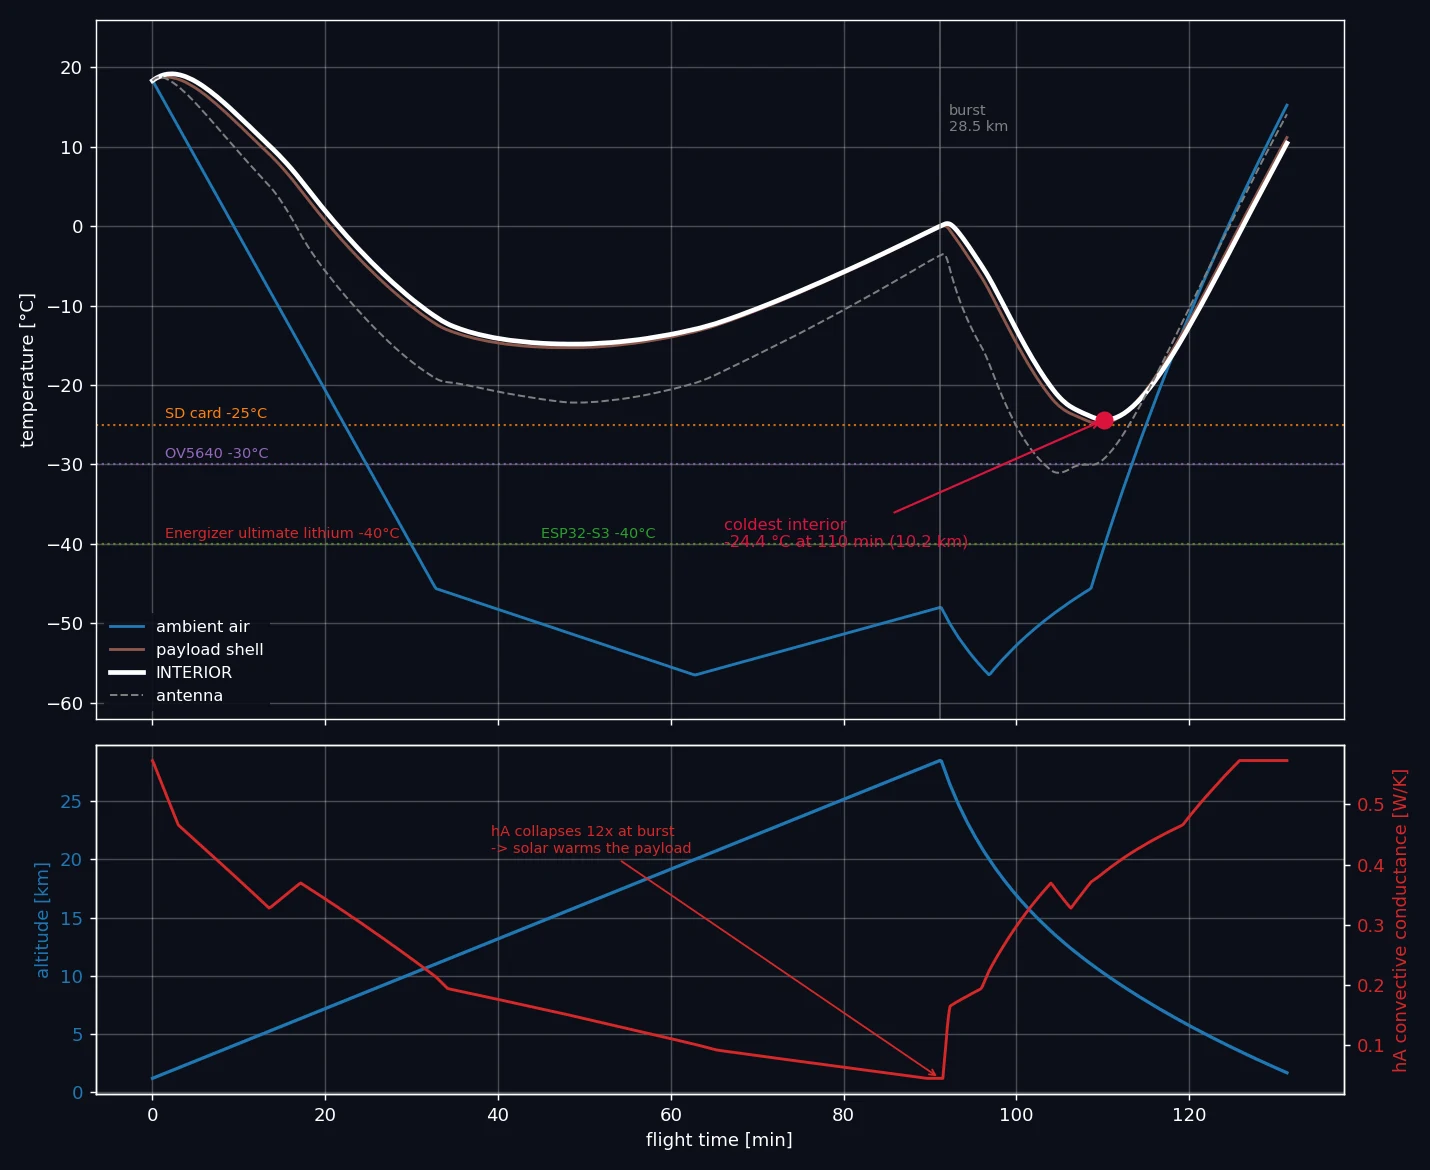
Convective conductance varies twelvefold across the flight and collapses at burst. The payload decouples from air too thin to carry heat away, and sunlight warms it to 0 °C at 28.5 km. So the coldest moment isn't burst, which is where I expected it. It's 110 minutes in, at 10.1 km on the way down, when descent has restored airflow while the air is still near -41 °C. Predicted interior minimum: -24.4 °C.
What the model changed about the build
The interior tracks the shell to within 1.7 K for the entire flight, so there's effectively no thermal separation between inside and outside. That cuts both ways. Anything done to the outside lands almost undiminished on the inside, and insulating the inside does close to nothing, because there's nothing to retain: 0.5 W of electronics across 1.09 W/K holds a half-kelvin gradient. The payload is in radiative deficit against a -180 °C effective sky, not leaking heat outward through its walls.
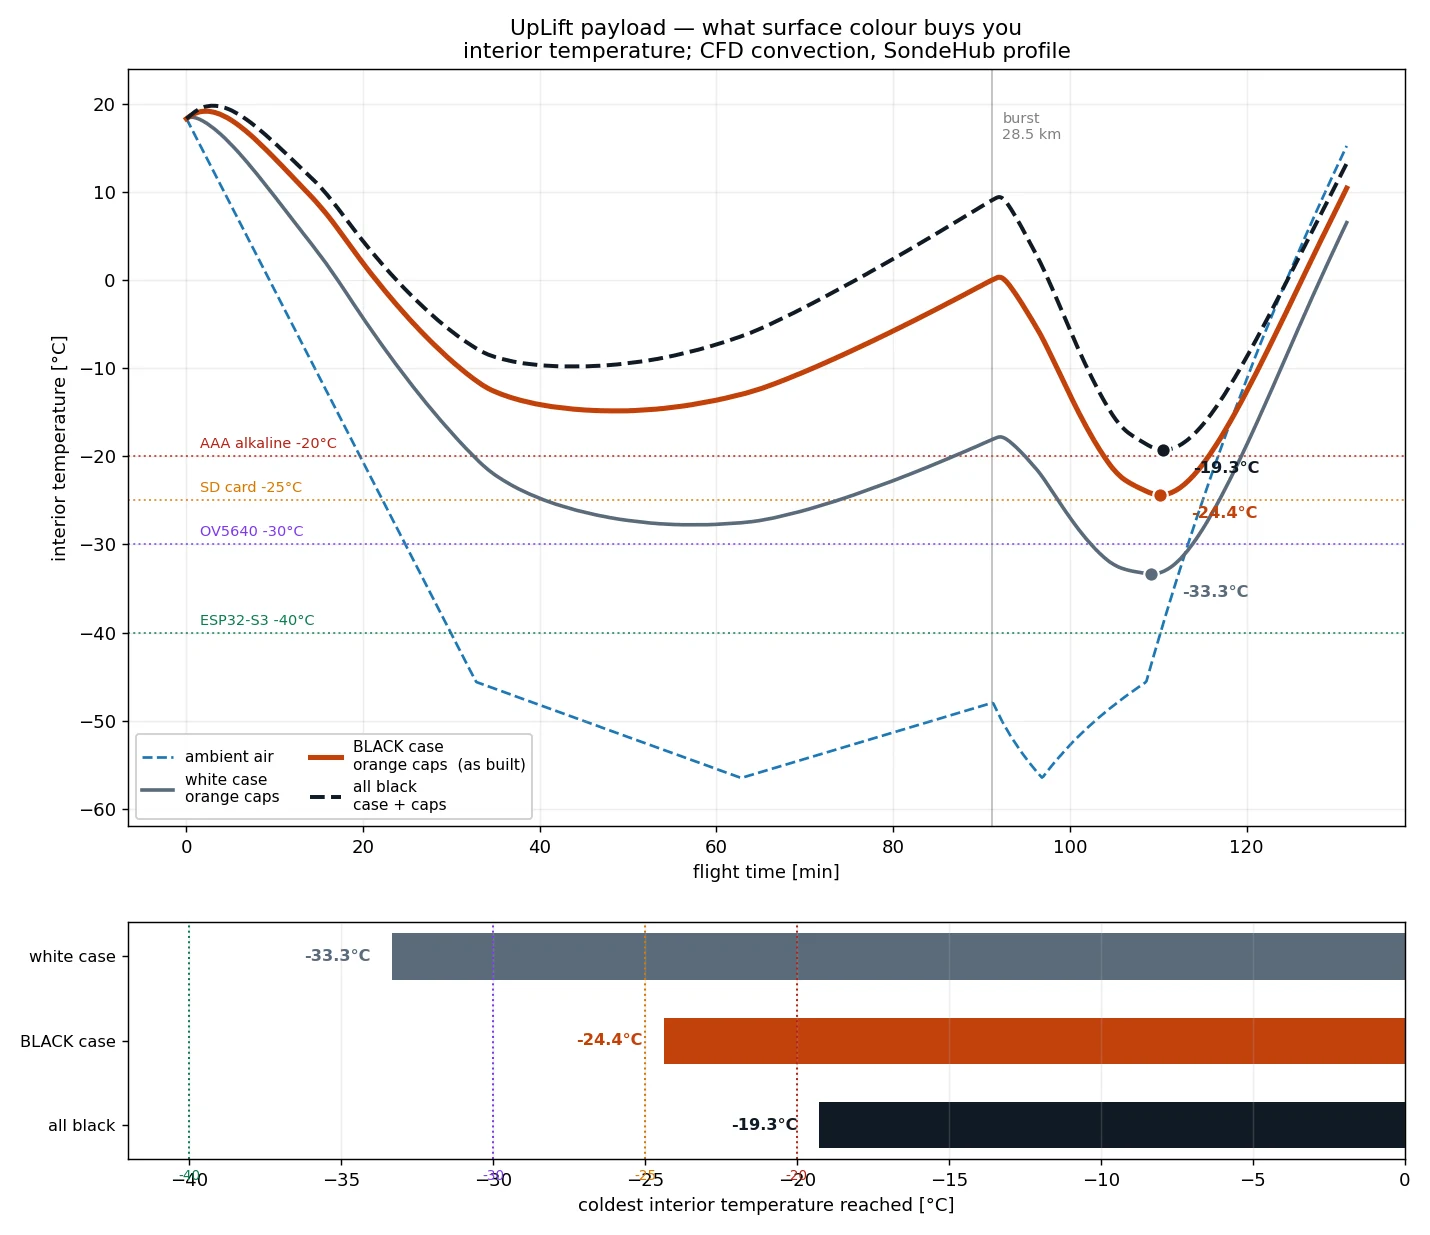
Ranked by how much each raises the coldest interior temperature: painting the case black, +9.5 K. Painting the end caps black too, another +5.1 K. A 2 W resistive heater, +6.6 K. A 10 mm XPS foam liner, +2.9 K. Thicker walls and more perimeters, +0.2 to +0.3 K. Surface color beat insulation by roughly 25x, which inverts the usual ballooning advice to fly light colors. That advice assumes you're fighting daytime overheating, and we weren't.
Re-weighing the case from an assumed 25 g to the measured 44 g moved the final answer 0.6 K, because thicker-walled conduction and greater thermal mass pull in opposite directions and nearly cancel. That's the most reassuring number in the study: the result doesn't rest on my foam conductivity model, which is the shakiest assumption in it.
Component margins at -24.4 °C came out as ESP32-S3 +15.6 K, OV5640 camera +5.6 K, SD card +0.6 K, alkaline AAA -4.4 K. Black paint alone moved the camera from 3.8 K under its rating to 5.6 K clear. Two items still needed doing: lithium AAA cells instead of alkaline, rated to -40 °C and free thermally, and an industrial-temperature SD card, because +0.6 K is inside the model's own uncertainty and isn't a margin. The payload flew black, on lithium.
The sensor pods, and an A/B test I compromised
The onboard experiment was a comparison: two pods bolted to the lid, one printed in foaming LW-PLA and one in ordinary PLA, each holding a temperature sensor, to see whether the foamed filament insulates measurably better.
The model's verdict on that was uncomfortable. Both pods read warm, and how warm depends almost entirely on how they're mounted rather than what they're made of. On isolated standoffs the bias is +9.9 K for the foam pod and +10.5 K for the PLA one. Press-fit into the lid it's +32.9 K and +37.5 K. With a trapped air gap, +45.6 K. Mounting spans 10 to 46 K while the material difference is 0.6 to 4.6 K, so the mounting swamps the effect the experiment exists to measure.
Painting the body black made this much worse. The pods bolt into the lid, and the lid is conductively tied to a black, solar-heated body, so press-fit bias rises from +22 K to +33 K. The paint that rescued the electronics corrupts the outside-air measurement. They're independent problems with independent fixes: keep the paint, isolate the pods, and don't let the paint carry over onto the pods themselves. A painted pod on isolated standoffs goes from +9.9 K to +32.4 K of bias, because at that point the housing is heating itself.
On descent the two pods sit in an asymmetric separated wake and their convective coefficients differ by 11 to 44%, which is larger than the material effect being measured. The descent half of the A/B test is confounded by geometry. Only the ascent leg is comparable, where mirrored geometry forces the two to agree to within 1%.
This is the part of my own work I'm least happy with. I ran the analysis late, late enough that it used the measured mass of an already-printed case, so all of those findings arrived after the geometry was frozen. Every one of them was actionable at CAD time and none of them were actionable by the time I had them.
What the flight measured, and where the model was wrong
The payload logged 6,741 received packets. A handful are corrupt in ways that survived the radio's error detection, with altitudes of 23,000 km and temperatures of -319 °C, so anything derived from the file has to be filtered first. 6,690 rows are physically possible and GPS-locked. Those give a burst altitude of 28.42 km and 140.2 km of ground track, matching Andrew's figures, across 328 distinct images.
The pods bottomed out at -18.2 °C for PLA and -17.4 °C for foam, at 14.3 and 13.5 km on the descent. Against the model's own ambient profile at those altitudes, -49.6 and -48.6 °C, that's a bias of +31.4 K and +31.2 K. The model's prediction for pods in conductive contact with the lid was +32.9 K and +37.5 K. The sensors were sealed into the pods with hot glue, which is conductive contact, so this is the regime the model put us in and roughly the magnitude it predicted. One caveat: ambient there is my own atmosphere table rather than an independent measurement, so it's a consistency check and not a validation.
The two pods read the same. Over the whole flight the foam-minus-PLA difference has a median of +0.18 K, and on the ascent leg, the only leg the model says is comparable, a median of -0.06 K inside a -2.8 to +4.0 K spread. There's no filament effect visible in the data at all. That matches what Andrew concluded from the flight, and it's what the model implied would happen: mounting and wake asymmetry dominate, and the material sits below the noise floor.
Where the model was plainly wrong is the flight itself. It ran the SondeHub prediction, a 131-minute flight bursting at 91 minutes. The real flight was close to five hours, because the balloon went up underfilled and climbed at 1.5 to 3 m/s instead of 5. The actual cold soak lasted more than twice as long as anything I simulated. It didn't hurt us thermally, but the margins I reported were margins for a flight that didn't happen. If I'd modeled the flight we actually got, the batteries running out at 4.5 hours would have shown up as a hard constraint on the mission instead of a footnote about endurance.
The model also ran cold. Its interior node predicted -24.4 °C, and the nearest thing actually measured, the microcontroller die, never went below +4.3 °C. Those aren't the same node, since a die with self-heating sits well above the cavity around it, so the numbers aren't directly comparable. But it's a 29 K gap, and it points the same way the pods do: the real payload ran warmer than I modeled it.
The chase dashboard
Andrew's RTL-SDR ground station did the receiving and decoding. An earlier Pi-and-RFM9x listener I wrote was superseded by it and never flew. The dashboard sits on top of whatever the receiver writes: a Next.js app that polls an API route over the receiver's CSV once a second, so a decoded packet is on screen almost immediately.
The map is Leaflet, with the full trajectory as a polyline and the latest fix as a marker carrying a timestamp tooltip. It has a “Go to Last Point” button, which sounds trivial and is the control I used most. After panning around terrain you want one action that snaps back to the balloon.
Tiles are served off local disk, pre-cached to zoom 13 across the whole predicted corridor. Central Montana has no cell coverage worth depending on, and an online basemap is useless in exactly the situation you need a map.
Telemetry is a Plotly panel for the four temperatures, both pods plus the outside-air sensor and the MCU, with strip charts for altitude, RAM and battery voltage. Charts downsample to 500 points so they stay responsive across a multi-thousand-packet flight. A stats bar carries climb rate over the last few fixes, T+ since the first packet, and time since the last packet. That last number matters most when the link is marginal: without it, a frozen dashboard and a quiet balloon look the same. There's also a scrub bar to replay the flight from the beginning, which is how the CSV mostly got used afterward.
Battery voltage was on the dashboard and wrong for the entire flight. The voltage dividers had been damaged earlier in the project, so the panel plotted a flat, meaningless trace. Detecting the dead channel and labeling it unavailable would have been better than drawing a confident-looking line through bad data.
Launch day and the search
We launched from Townsend because Montana's winds run west to east and Townsend clears the mountains to its east easily. Jared Kamp came out with expertise from Montana State's BOREALIS program and ran the flight predictions, the NOTAM and the sheriff's notification. Andrew's dad and David Hansen worked the fill station and the release. The helium and regulator were donated by American Welding & Gas, which two high-school students couldn't otherwise have covered.
The fishing scale we planned to measure free lift with turned out to be broken, so lift got estimated on an inaccurate bathroom scale instead. The balloon went up underfilled. That one substitution is upstream of nearly everything that went wrong afterward: a five-hour flight instead of two, against 4.5 hours of battery.
I drove and navigated the chase east across the state, working off the dashboard and SondeHub. We held the link for most of it, with dropouts in canyons and through towns.
It went quiet about fifteen minutes before the projected landing, with the last fix at 7,585 m. The batteries had done their measured 4.5 hours almost exactly. The U4B backup tracker on 10 m had already stopped transmitting, and I still don't know why. Fifteen minutes out, a SondeHub prediction is good to maybe a 3 km radius. We searched farmland on foot and by car for around two hours, including private property we got permission to walk, and stopped when it got dark, seven hours into the chase. It's still out there somewhere near Judith Gap.
What I would do differently
Run the thermal analysis before freezing the geometry. Everything it found about sensor mounting was actionable at CAD time and useless by the time I had it.
Isolate the sensor pods on standoffs, mask them from the paint, and mirror them about the flow axis instead of the lid centerline, so the descent leg isn't thrown away to wake asymmetry.
Model the flight we're actually going to get, including a pessimistic ascent rate. A 131-minute prediction produced margins for a flight less than half the length of the real one.
Put the tracker on its own battery. The camera drew the power the tracker needed to survive its last fifteen minutes, and that's the difference between a recovered payload and this page.
Measure the paint. Solar absorptivity is the dominant assumption left in the model. An absorptivity of 0.95 is a published matte-black figure, not a measurement of what went on the case, and the answer moves 0.7 K for every 0.05 it is off by. That's enough to erase the SD card's margin on its own.